How to Create Beautiful WordPress Charts and Graphs
- Category : WordPress
- Posted on : Mar 28, 2018
- Views : 3,182
- By : Kapueo I.

Whether you’re a researcher compiling data about a local election or a teacher sharing data about the local wildlife population with your class, there are no better substitutes than charts and graphs. These visual tools turn boring, seemingly worthless data into easily-digestible information.
What’s great is that you don’t have to worry about handling a complex graph-building software, since WordPress graphs and charts can be made with simple plugins. Therefore, we’re here to outline which of those plugins are the best, and we’ll also go into how to create beautiful WordPress charts and graphs.
Advantages of Making Charts and Graphs in WordPress
You might be wondering why you couldn’t simply develop a graph or chart in, say, Excel, then take a screenshot of it to place it in your blog post. Sometimes this method works fine, but other times it’s a huge waste. The main reason you would go with Excel, or another chart building program, is when you need an advanced feature that’s not available through a WordPress plugin.
Otherwise, here are the benefits of making WordPress charts and graphs with plugins:
- It consolidates all of your graph building into one area. If you make graphs or charts on a regular basis, this saves you loads of time.
- It allows you to go back and edit the graph if needed. A picture limits quick fixes and requires you to find that old file you used to make the graph.
- Some charts and graphs have interactive features, which would never be possible with a picture.
Overall, a WordPress chart plugin simplifies the process, but it still gives you most of the features you’ll need for your blog posts.
5 Effective WordPress Charts and Graphs Plugins in 2019
Before we get started with a tutorial on how to create beautiful WordPress charts and graphs, we want to walk through the best plugins to accomplish what you need.
- wpDataTables
- WordPress Charts and Graphs Lite
- WordPress Charts
- Interactive Maps, Charts, Graphs
- UberChart
1. wpDataTables
wpDataTables is a very robust WordPress plugin! Don’t let the name fool you. It can do a lot more than just create your typical tables. You can design all sorts of charts and graphs as well. It was specifically developed to allow you to input large amounts of data and quickly turn that into a nice graphical display for you readers.

wpDataTables is a premium plugin, starting at $44 for a license. It currently has over 13,000 sales on CodeCanyon with a 4.5 out of 5-star, so you can rest assured there are a lot of people happily using it. Some of its features include:
- Everything is responsive, meaning they will scale beautifully for every device
- wpDataTables plugin has three different chart rendering engines: Google Charts, Highcharts, and Chart.js. This allows you to render simple and flexible charts with a lot of customizable options
- Real-time auto-refresh for tables and charts
- Preview your charts in the backend along with the table
2. WordPress Charts and Graphs Lite
If you want to display data and information on your WordPress blog using beautiful charts and graphs, look no further than the excellent, WordPress Charts and Graphs Lite plugin. It does a wonderful job of creating beautiful and interactive visuals while giving you total freedom to customize the output to make it suit your exact requirements: you can change colors, customize fonts, hide text, add text — all this even after the chart is published. Displaying charts in your posts and pages is as simple as uploading a spreadsheet and adding the shortcode the plugin automatically generates to your page.
Later, if you decide you want to change the type of graph from, say a block graph to a pie chart, simply hit the edit button and make the switch. Yep, it really is as easy as that. It’s also worth mentioning that the charts and graphs it produces work on all device screens (desktops, tablets, mobiles) of all sizes because the plugin is responsive.

It includes nine chart types, shortcode support, and the option to import loads of data with a CSV. This chart plugin is also referred to as the Visualizer plugin, so you might see it referred to as that. There is both a free and pro version. The Pro Version goes for at least $74 (one site license,) and it offers tools for importing from other charts. Some other Pro features include:
- The option to give users editing capabilities
- Private chart creation
- Auto-syncing with your online file
- Additional chart types
- You gain access to a live editor
The Lite plugin is still pretty powerful. Here are some of the charts you can make:
- Line chart
- Pie chart
- Bar chart
- Column chart
- Area chart
- Geo chart
- Table chart
- Guage chart
- Candlestick chart
- Combo chart
- Scatter chart
- Timeline chart
3. WordPress Charts
The WordPress Charts plugin would be my third choice, many users like it for the clean designs, animations, and colorful options. However, also be aware that it hasn’t been updated for quite a while.
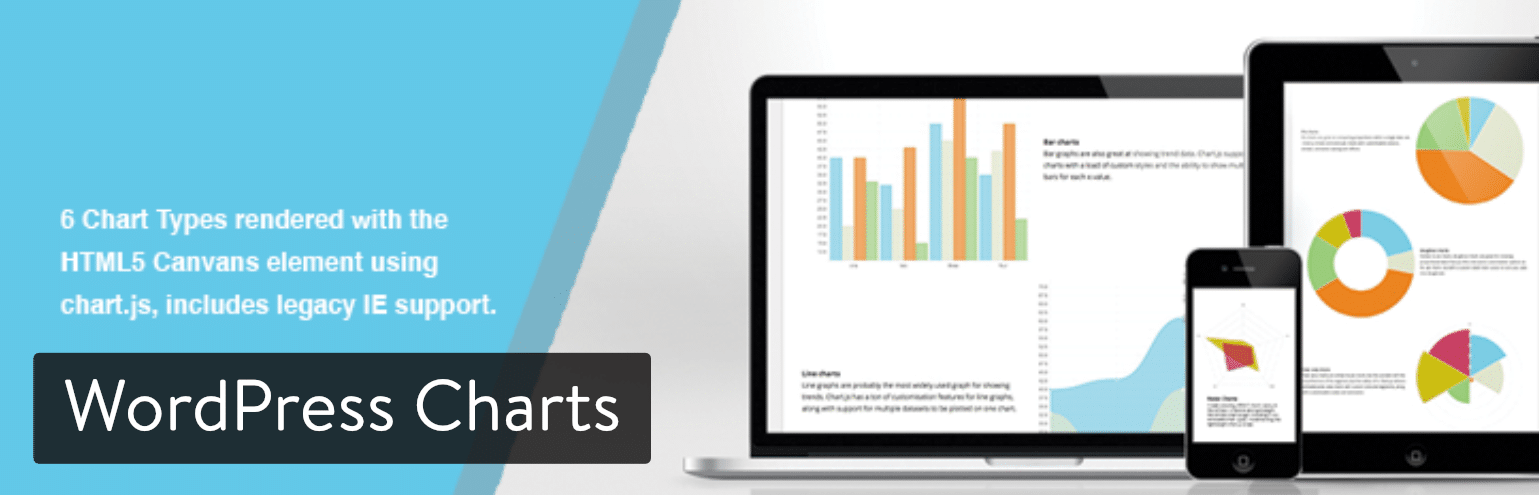
The WordPress chart plugin offers six unique chart and graph templates, which you can adjust and insert your own data to display on your website. The charts offered include:
- Line
- Bar
- Pie
- Radar
- Polar area
- Doughnut types
All of these charts are built using HTML5. The customization options are pretty much endless, but you will have to know a little bit about coding, shortcodes, or at least adjusting the default settings. The reason we like this WordPress chart plugin so much is that it’s extremely lightweight. You could insert dozens of charts on all your blog posts and not have a problem. And that’s the whole point of working with HTML5. You get to remove the clutter without sacrificing any of the functionality.
4. Interactive Maps, Charts, Graphs – For VC
If you currently have the Visual Composer plugin on your website, the Interactive Maps, Charts, Graphs plugin might be for you. It’s an add-on to Visual Composer, so there’s no reason to get it otherwise.

The add-on sells for $12, which then provides interactive maps, charts, and graphs, all packaged into the Visual Composer interface. The add-on comes with vector icons, Google Fonts, unlimited colors, and a wide set of other features for constructing and customizing your charts and graphs. The add-on has your standard charts and graphs, such as pie and line graphs. There’s also a unique map feature for highlighting certain areas, whether it be a local map or one of the world.
5. UberChart – WordPress Chart Plugin
UberChart is a more versatile premium chart plugin, since it doesn’t require the Visual Composer plugin. The plugin provides 10 built-in chart types, for which you receive around 240 customizable options per chart.
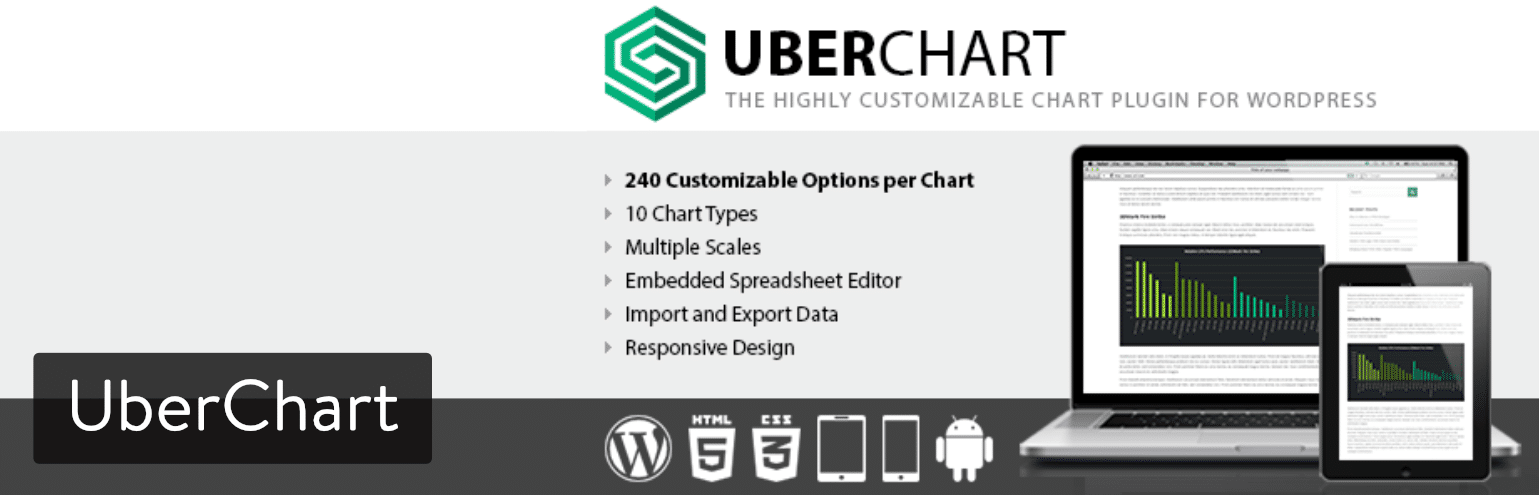
You can export and import data with the click of a button, and the responsive design ensures that all your graphs show up on every device. Some of the chart types include:
- Line charts
- Area charts
- Bar charts
- Pie charts
- Doughnut charts
- Bubble charts
The most impressive part of this WordPress chart plugin is the spreadsheet editor. It allows you to copy data from whatever program you want (like Excel,) bringing together the more advanced features from Excel and the versatility of a chart plugin.
How to Create Beautiful WordPress Charts and Graphs
One of our favorite chart plugins is WordPress Charts and Graphs Lite. Therefore, we’re only going to walk through this tutorial with that plugin. The other chart plugins have similar tools but different interfaces. So, I’d recommend testing all of them out to see which one is right for you, as wpDataTables is also very robust!
Step 1: Install and Activate the WordPress Charts and Graphs Lite Plugin
Simple enough.
Step 2: Go to the Visualizer Library and Add a New Graph
As we mentioned briefly above, the WordPress Charts and Graphs Lite plugin is also referred to as Visualizer. It’s somewhat difficult to find the settings page, but all you have to do is go to Media > Visualizer Library. There aren’t any other settings you have to configure before getting started with your WordPress charts.
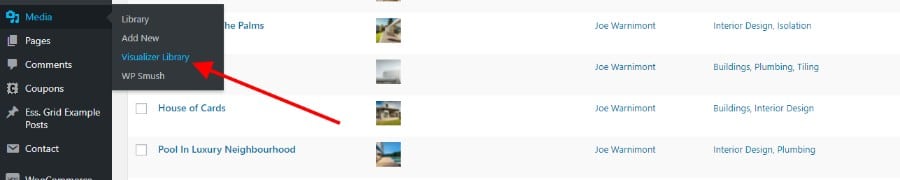
Upon landing on the Visualizer Library, you’ll see a message that says “No charts found.” That’s completely fine, since we haven’t made any charts yet. Therefore, you should click on the Add New button towards the top of the page.

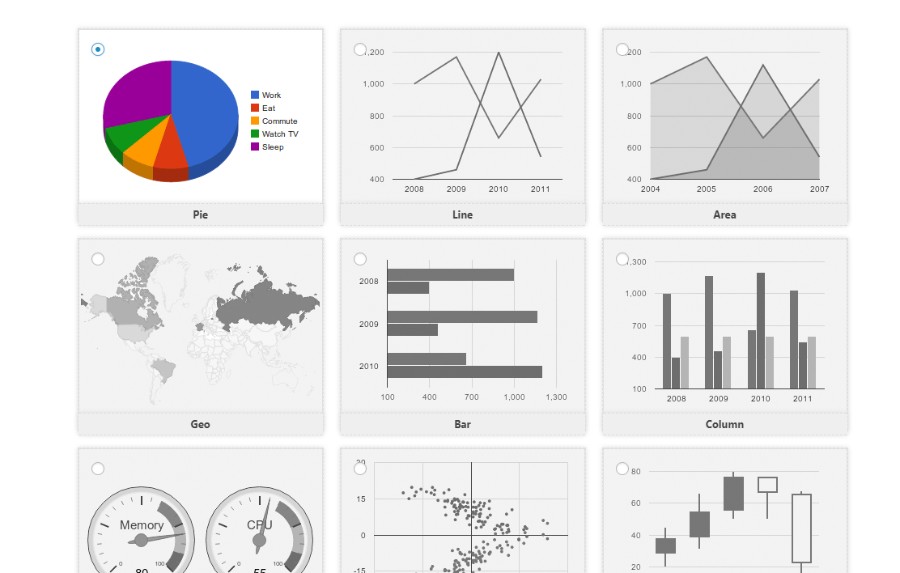
This reveals all the WordPress charts and graphs you can make with the plugin. For example, it has pie, line, area, geo, and bar charts. Nine WordPress charts are provided in the free version. You can get three more charts if you pay for the pro version. Anyway, I’m going to select a Pie chart for this tutorial.
Step 3: Import Data into the WordPress Chart
The plugin automatically inserts data so that your chart has something to display. However, in order to present your own data, you’ll need to import it using one of five methods. You can:
- Import data from a file (probably the most common method)
- Import data from a URL
- Import from another chart
- Import from WordPress (only available in the Pro Version)
- Import data manually (only available in the Pro Version)
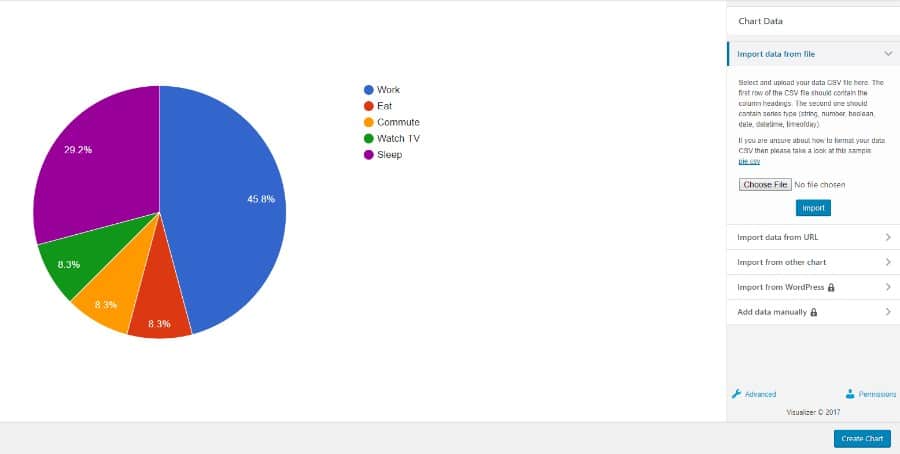
For this example, I’m importing data from a CSV file. It originated as an Excel file, which is one of the more common ways to get data into a WordPress chart or graph. When importing data from a file, click on the Choose File button, find the file on your computer, then hit the Import button on your WordPress dashboard.
This should show you a preview of what your data is going to look like on the left. The good news is that you can always go back and adjust the formatting on your CSV and try again. There are also plenty of customization tools in the next step to make things look a little better.
Step 4: Customize Your WordPress Chart
There’s a small link that says “Advanced” below all the importing options. Click on this to reveal your customization settings. There are quite a few options to play around with, so we won’t go through all of them here.
But we can begin with the Chart Title. I’ll type in something like “Where Does Your Time Go?” since my chart outlines the percentage of time that people spend on certain tasks throughout the day. I can also change the font, font size, color, and location of the title.
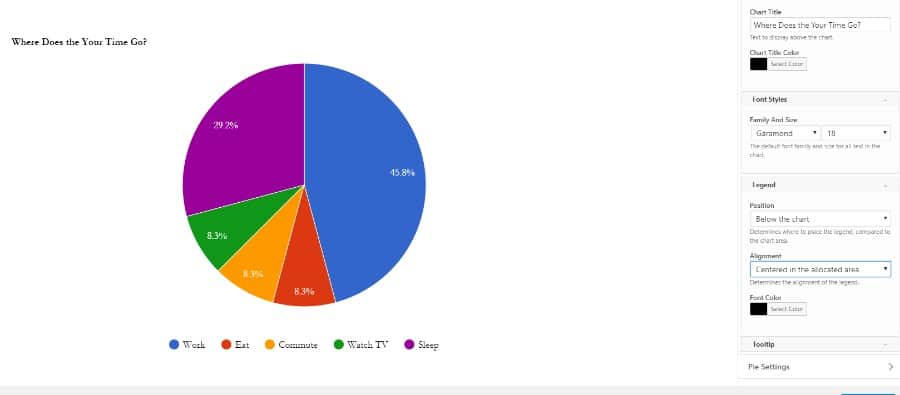
As you move through the settings, you’ll notice several tabs for things like general settings, slice settings, frontend actions, and more. You’ll most likely want to decide on where the legend is going to reside, since this is an essential part of the graph.
Other than that, it completely depends on what type of graph you’re trying to make, and what elements you need to display. I’m going to pretend that this is a WordPress chart for a bunch of students I have. Therefore, I’d like to give them the option to print and download the data and graph.
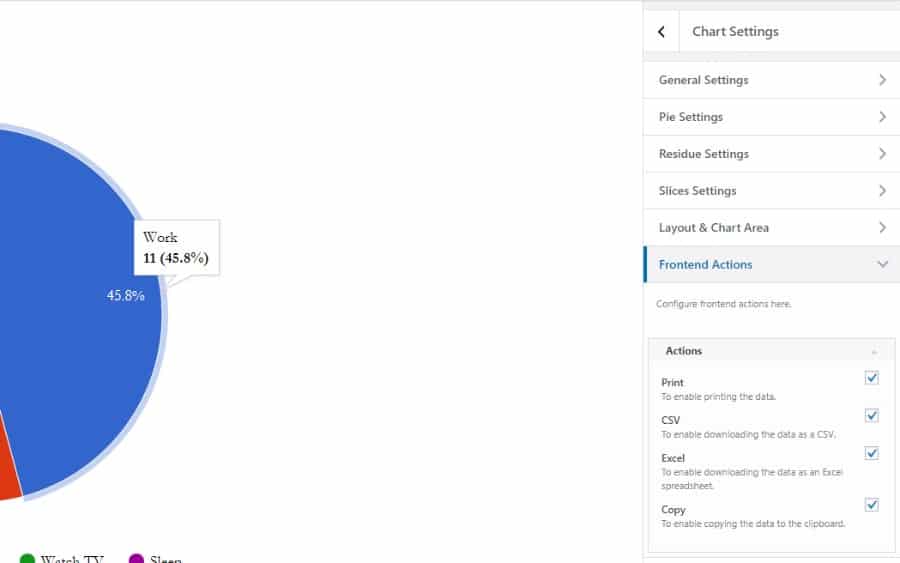
To do this, go to the Frontend Actions tab. This reveals checkboxes for enabling users to print and copy the data. You can also give them downloadable Excel sheets and CSVs. Once you’re done customizing your graph, make sure you save it.
Step 5: Copy the Shortcode into a Page or Post
After saving your WordPress chart or graph, navigate back to the Visualizer Library. You’ll see a list of your charts, and you can filter based on the chart types. Since I only have one chart right now, I can instantly see it as the only option. In order to publish your WordPress chart on a page or post, you must copy the chart’s shortcode and paste it into the desired page or post. The shortcode is located under the chart preview (see screenshot below).

Once you copy the shortcode, either create a page or post, or go to one that’s already published. Find where you’d like the graph to go and paste in the shortcode.
Step 6: View the WordPress Graph on the Frontend
I’d recommend previewing your graph before hitting the Publish button. This way you know what’s going out to your users, especially since WordPress charts and graphs can be rather finicky. If you take a look at the screenshot below you’ll see a preview of my test graph on the frontend of a website. The Print and Download buttons are visible, the WordPress chart has some nice animations when you scroll over, and the colors and title elements look nice.
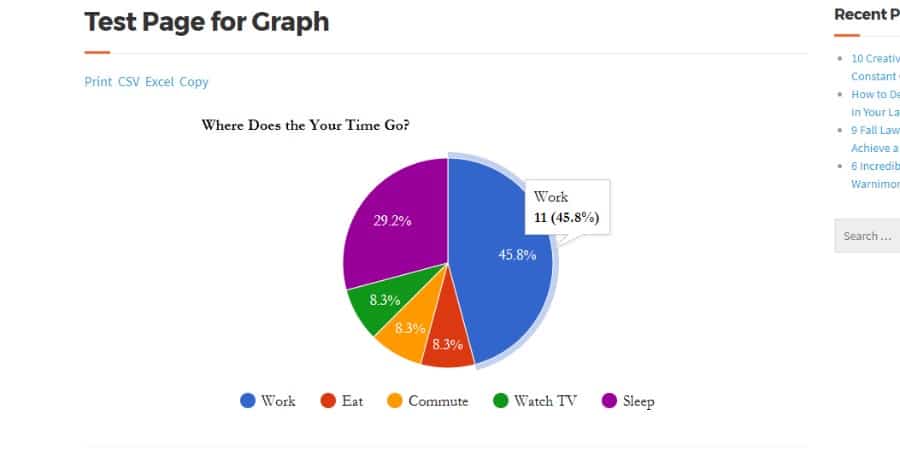
The changes happen instantly in a live preview so you can see how they affect the graph without having to save and view the page in a new tab. There’s one more feature worth mentioning, and it’s pretty awesome. Not only can you edit the styling options of a chart, but you can also edit the data within the charts by uploading another file, overwriting the original, and replacing the old data with the new.
Questions on How to Create WordPress Charts?
All WordPress charts and graphs have their different functions. The cool part about these plugins is that you have all the flexibility in the world. Therefore, I encourage you to spend time testing your graphs and understanding what each setting adjustment does. Then, you’ll eventually become a chart master, and people will be asking you how to do it. If you have any questions or thoughts on how to create WordPress charts and graphs, drop a line in the comments below.
Categories
Subscribe Now
10,000 successful online businessmen like to have our content directly delivered to their inbox. Subscribe to our newsletter!Archive Calendar

| Sat | Sun | Mon | Tue | Wed | Thu | Fri |
|---|---|---|---|---|---|---|
| 1 | 2 | |||||
| 3 | 4 | 5 | 6 | 7 | 8 | 9 |
| 10 | 11 | 12 | 13 | 14 | 15 | 16 |
| 17 | 18 | 19 | 20 | 21 | 22 | 23 |
| 24 | 25 | 26 | 27 | 28 | 29 | 30 |
| 31 | ||||||
Recent Articles
-

Posted on : Jul 25
-

Posted on : Jul 07
-

Posted on : Apr 07
-

Posted on : Mar 19
Optimized my.cnf configuration for MySQL 8 (on cPanel/WHM servers)
Tags
- layer 7
- tweak
- kill
- process
- sql
- Knowledge
- vpn
- seo vpn
- wireguard
- webmail
- ddos mitigation
- attack
- ddos
- DMARC
- server load
- Development
- nginx
- php-fpm
- cheap vpn
- Hosting Security
- xampp
- Plesk
- cpulimit
- VPS Hosting
- smtp
- smtp relay
- exim
- Comparison
- cpu
- WHM
- mariadb
- encryption
- sysstat
- optimize
- Link Building
- apache
- centos
- Small Business
- VPS
- Error
- SSD Hosting
- Networking
- optimization
- DNS
- mysql
- ubuntu
- Linux