
How to Reduce TTFB to Improve WordPress Page Load Times
- Category : WordPress
- Posted on : Feb 18, 2018
- Views : 3,291
- By : Odalis J.

When it comes to the overall speed of your WordPress site, a lot of times we focus on front-end performance and optimizations to improve page load speeds. However, sometimes it is good to look at it from the server-side, where your website originally starts loading. Today we are going to dive into how TTFB (time to first byte) affects you and discuss some easy ways on how to reduce it. TTFB is commonly an overlooked performance factor, but it should be taken into consideration when testing the speed of your site.
- What is TTFB?
- Is TTFB Important?
- How to Measure Your TTFB
- 4 Ways to Reduce TTFB on Your WordPress Site
What is TTFB?
TTFB stands for time to first byte. To put it simply, this is a measurement of how long the browser has to wait before receiving its first byte of data from the server. The longer it takes to get that data, the longer it takes to display your page. A common misconception is that this is calculated after DNS lookup times, however, the original calculation of TTFB in networking always includes network latency. This involves a 3 step process and delays and latency can occur anywhere in between, adding up to your total TTFB.

1. Request to Server
When someone visits your website, the first thing that happens is an HTTP request is sent from the client (browser) to the server. In this step, there are a variety of factors that can introduce delays. Slow DNS lookup times could contribute to increased time for the request. If the server is located geographically far away, this can introduce latency in the distance the data has to travel. Also, if you have complex firewall rules this could increase routing time. And don’t forget the client’s internet speed.
2. Server Processing
After the request has been sent, the server now has to process it and generate a response. This could introduce a number of different delays such as slow database calls, too many 3rd party scripts, not caching your first response, badly optimized code or WordPress theme, and inefficient server resources such as disk I/O or memory.
3. Response to Client
After the server processes the request, it then has to send it back to the client (or rather send back the first byte). This is heavily affected by both the network speed of the server and the client. If the client has slow internet from a Wi-Fi hotspot, it is going to reflect in the TTFB.
Is TTFB Important?
It is important to understand that TTFB (time to first byte) is not the same as website speed. This is really a measurement of responsiveness. There are a lot of discussions around the web on whether or not TTFB is important. Some say it is meaningless (Cloudflare, LittleBizzy), and others say it is important (Ilya Grigorik, Web Performance Engineer at Google). Both sides bring up some valid points on why or why it isn’t important and also some questions about how it is actually calculated.
Moz even did an in-depth study on the correlation between search rankings and time to first byte. However, it is hard to know if this was the cause or if the sites with lower TTFB were also simply faster in general, which in turn could be affected by Google’s page speed ranking factor.
However, rather than spending time harping over if it matters or not, we would rather focus on optimizations you can do to improve this metric. Everything you do can contribute to the overall speed of your WordPress site, and this will, in turn, affect your TTFB. In our tests sites with much greater TTFB simply load and feel slower.
Generally, anything under 100 ms is great and good TTFB. Google PageSpeed Insights recommends under 200 ms for server response time. If you are in the 300-500 ms range, this is pretty standard. And if you are over 600 ms, you might have something misconfigured on your server or it might be time to upgrade to a better web stack. Or follow our recommendations below on how to reduce your TTFB. And remember that SSL/TLS negotiation can also be a factor.
How to Measure Your TTFB
There is a multitude of different ways you can test your TTFB. We will explore a couple below. But remember, every tool will give slightly different results so it is important to simply use one and stick with it for a baseline.
Measure TTFB with Google Chrome DevTools
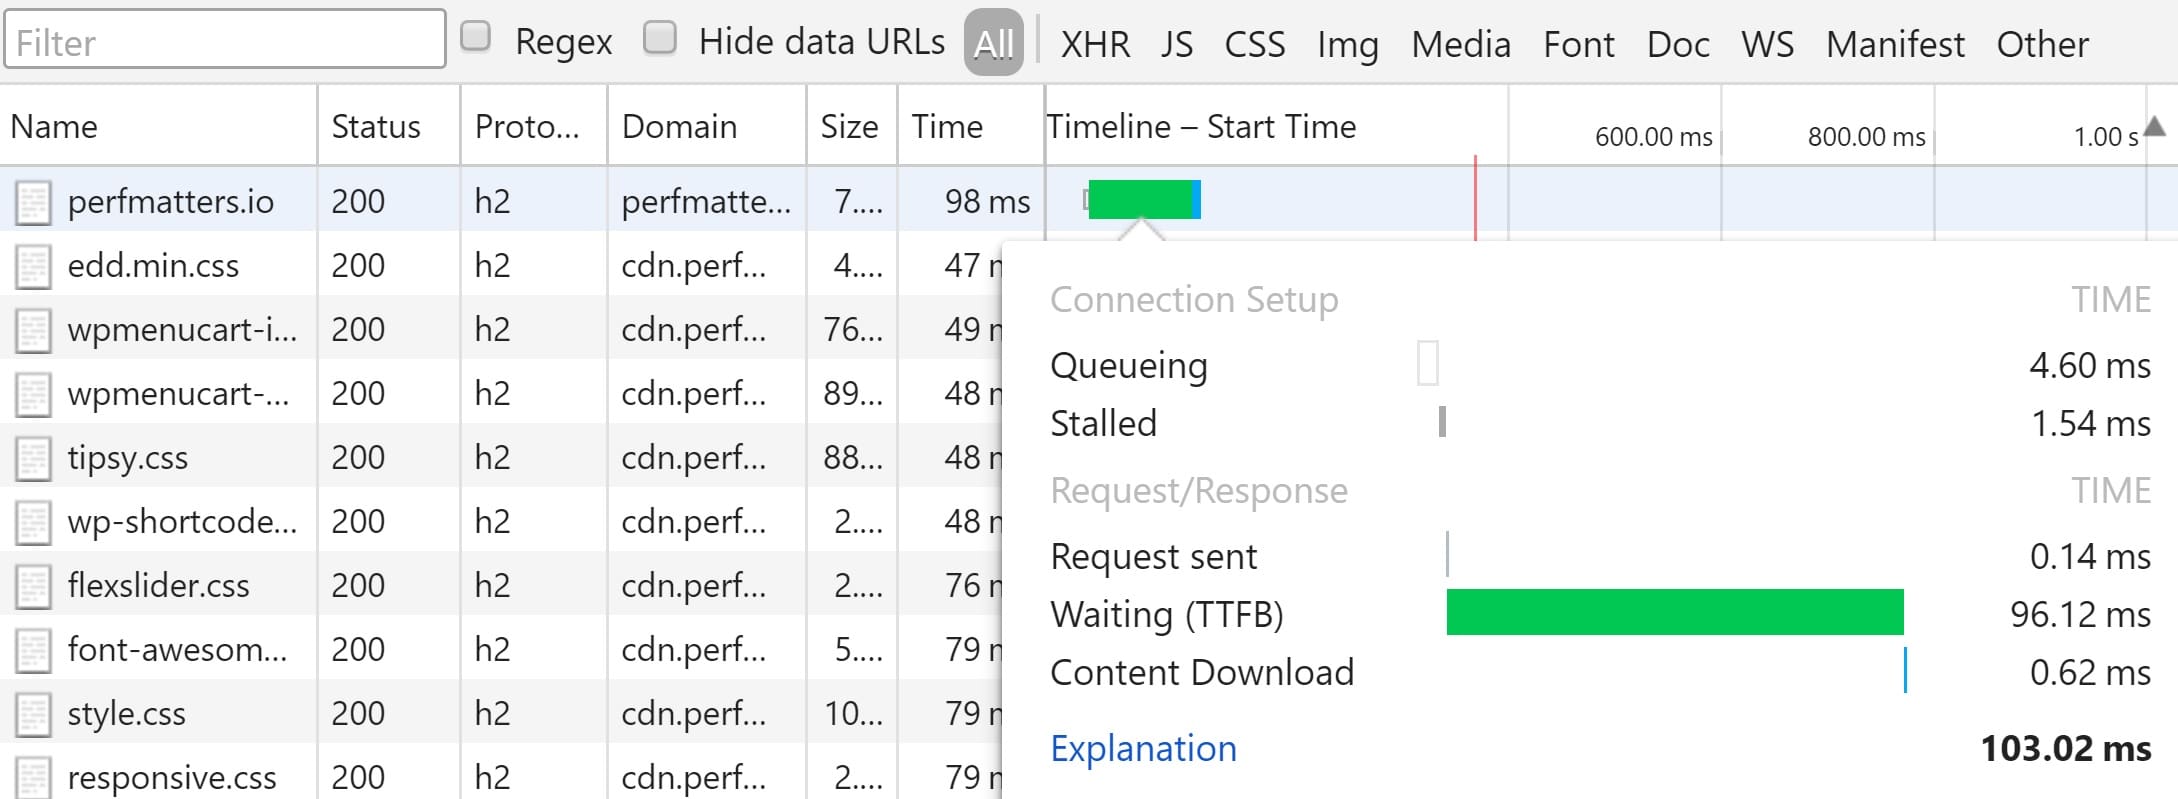
You can measure TTFB in Google Chrome by launching DevTools. Remember though, if you are testing from your computer that TTFB is affected by network latency and your internet connection. So it is probably more effective to use 3rd party tool (as seen further below) which is testing from a data center.
- Select More Tools > Developer Tools from the Chrome Menu.
- Right-click on a page element and select Inspect
- Use the keyboard shortcuts Ctrl+Shift+I (Windows) or Cmd+Opt+I (Mac)
You can launch the network window and see the performance of your site.
Measure TTFB with WebPageTest
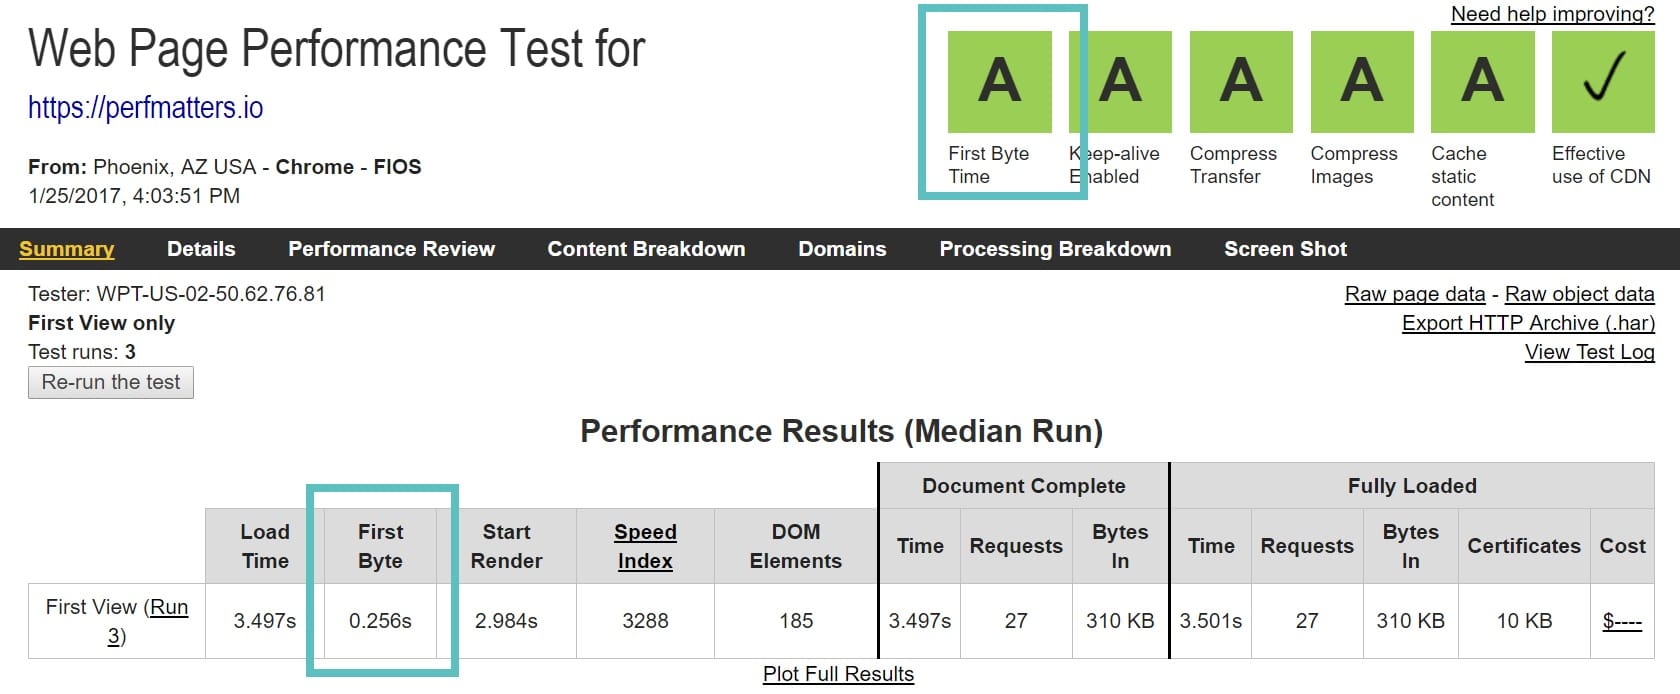
You can also measure your TTFB with WebPageTest. According to their glossary, the target time is the time needed for the DNS, socket and SSL negotiations + 100ms. A single letter grade will be deducted for every 100ms beyond the target. As you can see in our test below, this site measured in at 0.256s or 256 ms TTFB.
Measure TTFB with Pingdom
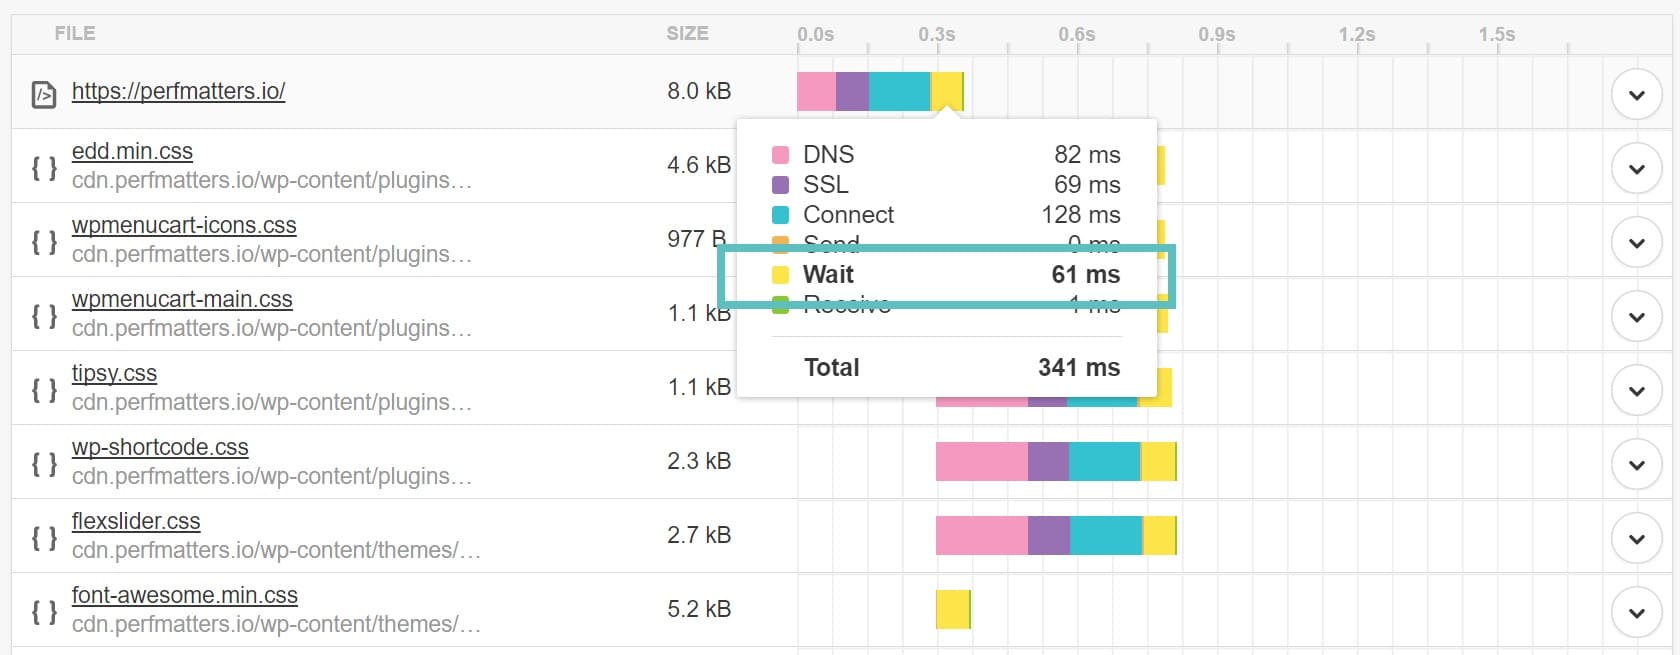
Chrome and WebPageTest refer to it as TTFB. However, if you are using Pingdom it is actually referred to as “Wait” time. Make sure to also check out our in-depth guide on how to use Pingdom.
Measure TTFB with GTmetrix
In GTmetrix, just like with Pingdom, TTFB is referred to as wait time. Make sure to also check out our in-depth guide on how to use GTmetrix.

Measure TTFB with Tool from KeyCDN
KeyCDN has a great